Eletricidade Predial
Software de automatização de Projetos para Instalações Elétricas Prediais em Baixa Tensão

Introduction
What this software does?
This software automates the creation of electrical installation projects for buildings with minimal user input. Simply provide the dimensions of each room and specify any special power outlets required, such as those for washing machines and motors. The software efficiently handles all necessary calculations, including the determination of the quantity and power capacity of general power outlets for different room types, lighting power, and the sizing of cables and conduits. These calculations adhere to the IEC (International Electrotechnical Commission) standards for Electrical Installations of Buildings, which, in Brazil, correspond to the NBR5410 regulations set forth by ABNT (Brazilian Technical Standards Association). Moreover, the software generates a comprehensive list of required materials, leveraging a pre-existing database of products, and provides an estimated budget.
A brief process history
I embarked on this project after completing my third Nanodegree in Data Science. I aimed to apply the knowledge and skills I had acquired, leveraging my background in Electrical Engineering and programming expertise. During this period, I was also studying Electrical Installation for buildings and encountered numerous challenges while using the available software. It led me to think, "Why not create my own software?" The result is now here.
Background
- Electrical Engineer Bachelor's degree from Sao Carlos Engineer School, Sao Carlos, Brazil EESC-USP. EESC-USP.
- Bioinformatics Specialist from Computational Science Lab, Petrópolis, Brazil, LNCC.
- ABNT certification for Low voltage Electrical Installation of buildings (Safety and Protection).
- Data Scientist
- Data Science Fundamentals I - Udacity
- Data Science Fundamentals II - Udacity
- Data Scientist Nanodegree - Udacity
Software workflow
In the picture below we can see a simplified software animation workflow.
A few numbers and graphics about the time spent
Stats only for this project
Total of commits in this project
1249
Number of days with at least one commit
232
Number of Deploys to Heroku
160
Number of lines in the main function
6897
Number of lines in scripts to help
19426
Commit graphic history
From left to right, those graphics are showing my work from 2018 October 1st to 2019 September 30th where each frame corresponds to 7 days.
- Total number of commits for each month.
- Total number of commits by weekday.
- Total number of commits by the hour of the day.
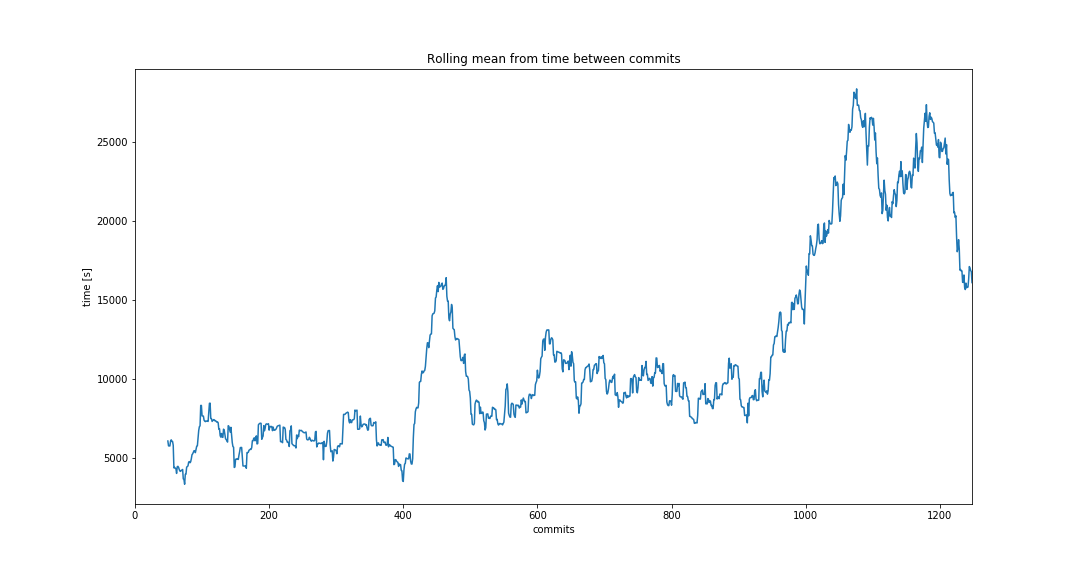
Rolling means from the time between commits
As I gained more confidence in using Git for version control, I began making commits more frequently. While doing so, I became curious about how much time I was spending between each commit. To track this information, I created a rolling mean graph with a window of 50 commits, as depicted in the image below. As I had anticipated, analyzing the time intervals between commits proved to be a valuable method for assessing productivity, especially once my routine and commit patterns became consistent.
Stripplot graphic